Bar Graph + Table 38
The graphs below show the global robotics market during 2000 and 2025 based on sectors. Summarize the information by selecting and reporting the main features, and make comparisons where relevant.
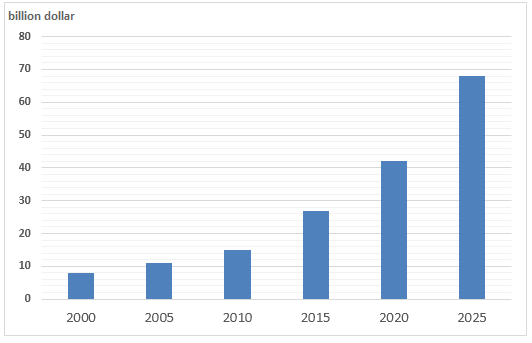
The diagrams give data on the global market of robotics in billion dollars from 2000 and give predictions until the year 2025. Overall, the market for robotics will significantly progress in the coming years and its industrial use will be predominant.
According to the bar chart, worldwide robotics business in 2000 was less than 10 billion dollars and in the next decade, it almost trebled. The outreach of robotics in the global market is predicted to go higher than 40 billion in 2020. Finally, in 2025, this is estimated to jump to approximately 70 billion dollars.
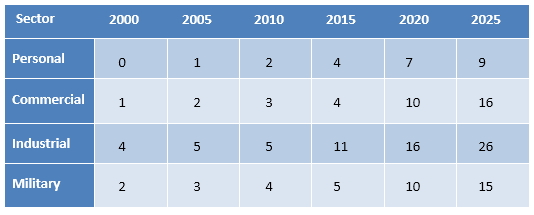
As the table data suggests, personal use of robotics was ignorable in 2000 but it reached to 4 billion dollars in 2015. It is forecasted that personal use of robotics technology will go as high as 9 billion dollars in 2025. Commercial use is also expected to rise and expand to 16 billion dollars in 2025 at which point industrial use of robotics would be the highest, 26 billion dollars to be exact. Finally, military use of this technology was 2 billion dollars in 2000 and it is projected to be 15 billion in 2025.