Line Graph 34
The line graph below shows the average monthly temperatures in three major cities. Summarize the information by selecting and reporting the main features, and make comparisons where relevant.
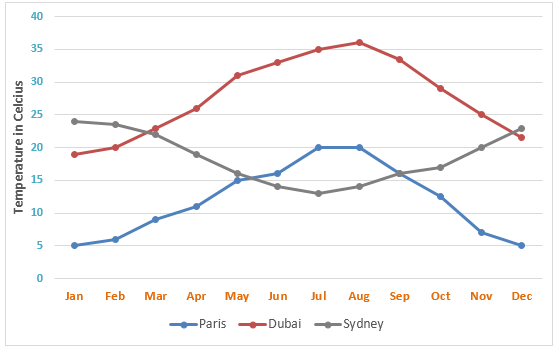
The average monthly temperature of three cities – Paris, Dubai and Sydney, is given in the bar graph and the data compares how the temperature in these cities changes throughout the year. The temperature is measured in Celsius. Overall, Dubai and Paris have a comparatively warmer condition between April and August while an opposite trend is witnessed in Sydney where first two and last two months of the year have a higher temperature.
As the illustration suggests, the temperature in Sydney in roughly 25-degree centigrade in January which is the warmest month of the year there. At that time, the temperature in Dubai is just below 20-degrees, which is the coldest month of the year in this city. With 5-degree centigrade, Paris at that time behold the coldest month of the year.
The temperature in Sydney remains above 20-degree till mid-March and then it keeps falling till July when it has nearly 13 centigrade temperature, the coolest. Through the rest of the year, the temperature there steadily increases before reaching 23-degree in December. Conversely, Paris’s temperature remains below 20-degrees throughout the year except in July and August. Paris seems like the coldest city among the three. Finally, the temperature in Dubai reaches as high as 36-degree centigrade in August and this city has a warmer condition from April to October.