Table Graph 24
The table below shows average hours and minutes spent by UK males and females on different daily activities. Summarise the information by selecting and reporting the main features, and make comparisons where relevant.
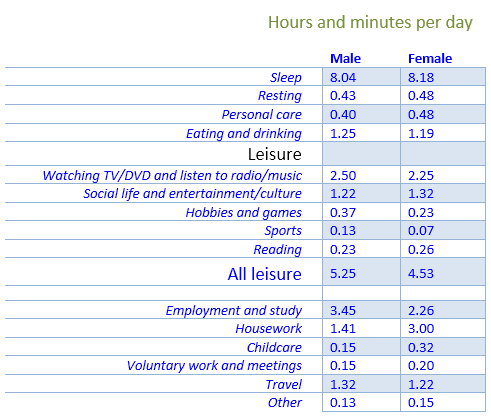
The table data illustrates how much time an average British male and female spent on various daily activities. It is apparently seen that sleeping consume the highest duration of a day while leisure and professional activities involve a notable portion of their time. Moreover, females do more house works and child-rearing than males do on a daily basis.
As can be seen, an average British male sleeps and rests just over 8 hours a day while female’s sleeping and resting time is slightly higher than that. A similar pattern could be observed on the duration of personal care by British. Further, a male takes an hour and 25 minutes to enjoy their meals while it is 6 minutes shorter for their counterparts.
Looking further, men spend 5:25 hours to enjoy their leisure activities while it is around 28 minutes less for females. Watching TV and enjoying music is a popular pastime activity among British as they spend over half of their leisure times on that. They spend less time reading or participating in sports than they do for watching TV and listening to music.
Men spend 3 hours and 45 minutes a day for professional and academic purposes, more than females involvement on this. However, females devote more time for household works, childcare and voluntary works, roughly 4 hours, compared to almost half of that by men.
Finally, British travel for nearly 1 and half hour daily and men employ slightly more time doing it than that of females.