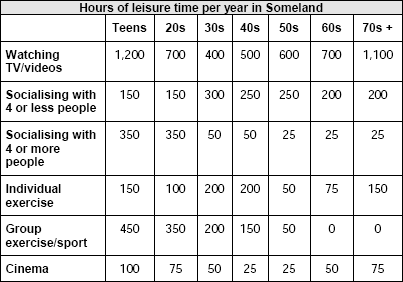
Write a report for a university lecturer describing the information in the graph below. You should write at least 150 words. Allow yourself 20 minutes for this task. model answer: The table shows how people in different age groups spend their leisure time in Someland over the course of a year. It can be clearly […]