10 graph samples from Volume 6 , topics 51 to 60
10 graph samples from Volume 6 , topics 51 to 60
15 graph samples from Volume 6 , topics 36 to 50.
10 graph samples from Volume 6 , topics 26 to 35
5 graph samples from Volume 6 , topics 21 to 25.
6 graph samples from Volume 6 , topics 15 to 20.
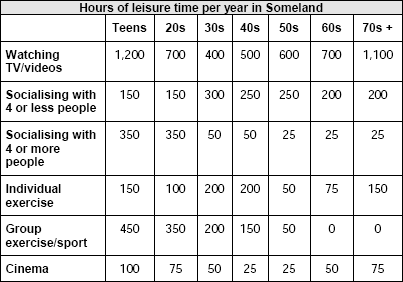
Write a report for a university lecturer describing the information in the graph below. You should write at least 150 words. Allow yourself 20 minutes for this task. model answer: The table shows how people in different age groups spend their leisure time in Someland over the course of a year. It can be clearly […]
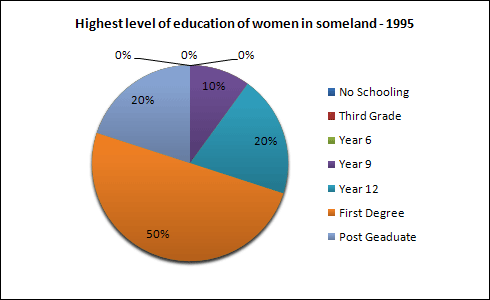
Write a report for a university lecturer describing the information in the graph below. You should write at least 150 words. Allow yourself 20 minutes for this task. model answer: The pie charts compare the highest level of education achieved by women in Someland across two years, 1945 and 1995. It can be clearly seen […]

Write a report for a university lecturer describing the information in the graph below. You should write at least 150 words. Allow yourself 20 minutes for this task. model answer: The graphs compare the number of deaths caused by six diseases in Someland in 1990 with the amount of research funding allocated to each of […]
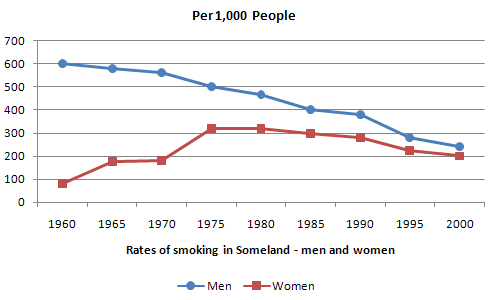
Write a report for a university lecturer describing the information in the graph below. You should write at least 150 words. Allow yourself 20 minutes for this task. model answer: The graph compares the rate of smoking in men and women in Someland between the years 1960 and 2000. It can be clearly seen that […]

The chart below shows the amount of leisure time enjoyed by men and women of different employment status.Write a report for a university lecturer describing the information shown below. You should write at least 150 words. Allow yourself 20 minutes for this task. model answer: The chart shows the number of hours of leisure enjoyed […]
copyright