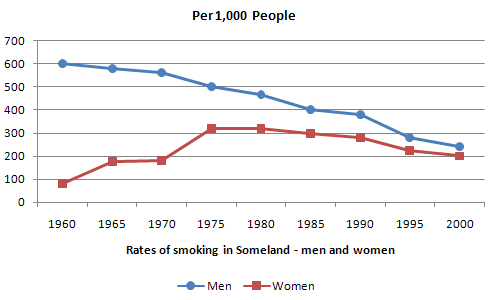
Write a report for a university lecturer describing the information in the graph below. You should write at least 150 words. Allow yourself 20 minutes for this task. model answer: The graphs compare the number of deaths caused by six diseases in Someland in 1990 with the amount of research funding allocated to each of […]